ScatterPlot 散点图/折线图控件
控件简介
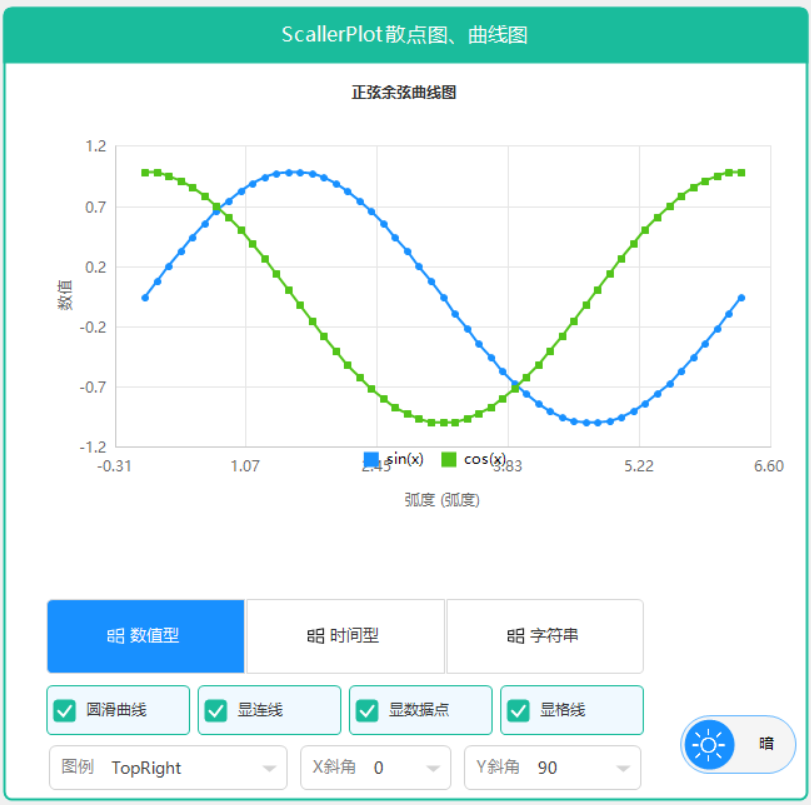
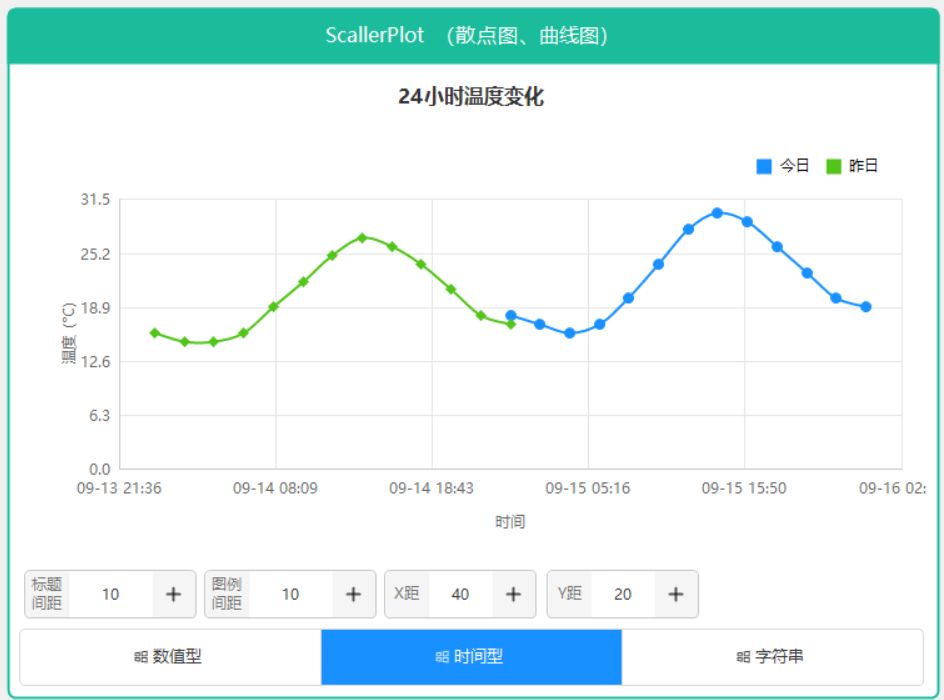
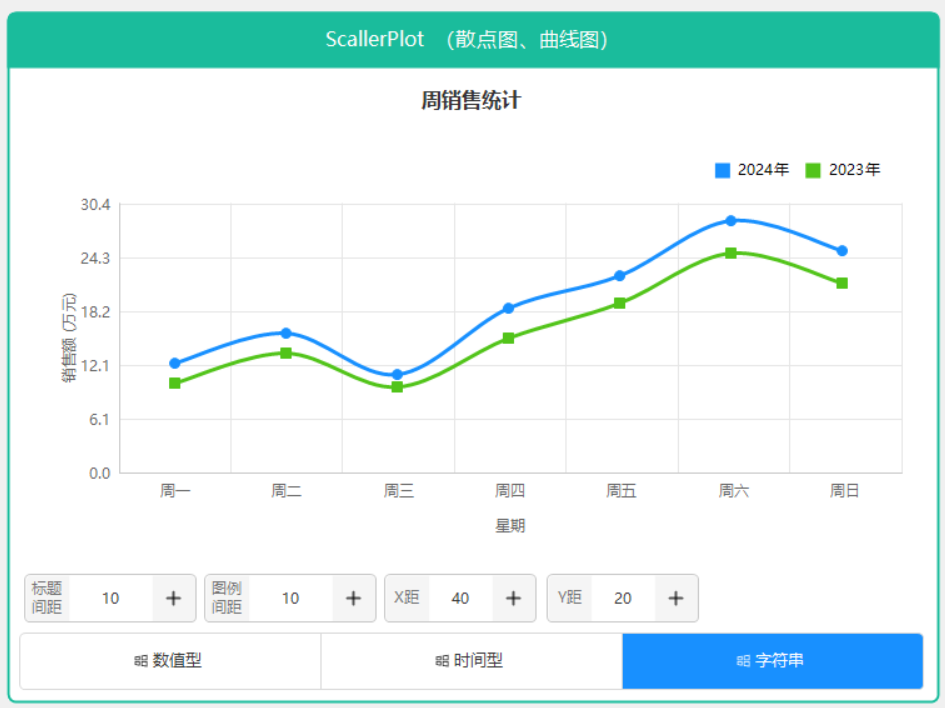
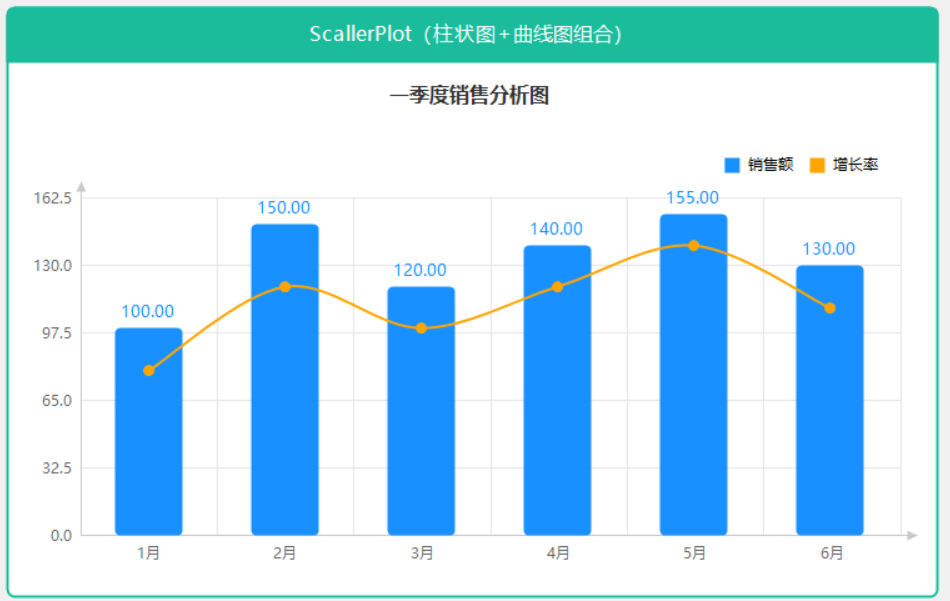
ScatterPlot 是一个功能强大的散点图、折线图和柱状图控件,参考 ScottPlot 设计,支持平滑曲线、多种X轴类型(数值型、字符串型、日期时间型)、网格线、值提示和图例显示。
主要特性
- 多种图表类型:支持折线图、散点图、柱状图,以及三者混合显示
- 多种X轴类型:支持 Numeric(数值)、Category(字符串类别)、DateTime(日期时间)
- 平滑曲线:支持 Smooth 平滑曲线显示,可调整张力
- 网格线:支持 X/Y 轴网格线显示控制
- 值提示:鼠标悬停显示数据点值,支持自动格式化
- 图例位置控制:支持 7 种图例位置(None, TopLeft, TopCenter, TopRight, BottomLeft, BottomCenter, BottomRight)
- 轴标签旋转:支持 X/Y 轴标签旋转角度设置
- 自动日期时间格式:根据时间跨度自动选择最优显示格式
- 坐标轴箭头:可选择在坐标轴末端显示箭头
- 属性变更通知:实现 INotifyPropertyChanged,属性值改变立即生效
基本使用
简单散点图
// 创建散点图控件
var scatterPlot = new ScatterPlot
{
    Dock = DockStyle.Fill,
    ColorType = ColorType.Primary
};

// 添加数据系列
var series = new ScatterSeries
{
    Name = "系列1",
    ShowLine = true,
    ShowMarkers = true,
    Smooth = true
};

// 添加数据点
for (int i = 0; i < 10; i++)
{
    series.Points.Add(new ScatterPoint(i, Math.Sin(i * 0.5) * 10 + 20));
}

scatterPlot.Series.Add(series);
scatterPlot.RefreshPlot();
this.Controls.Add(scatterPlot);
X轴类型设置
// 数值型(默认)
scatterPlot.XAxisType = XAxisType.Numeric;

// 字符串类别型
scatterPlot.XAxisType = XAxisType.Category;

// 日期时间型
scatterPlot.XAxisType = XAxisType.DateTime;