BarPlot 柱状图控件
控件简介
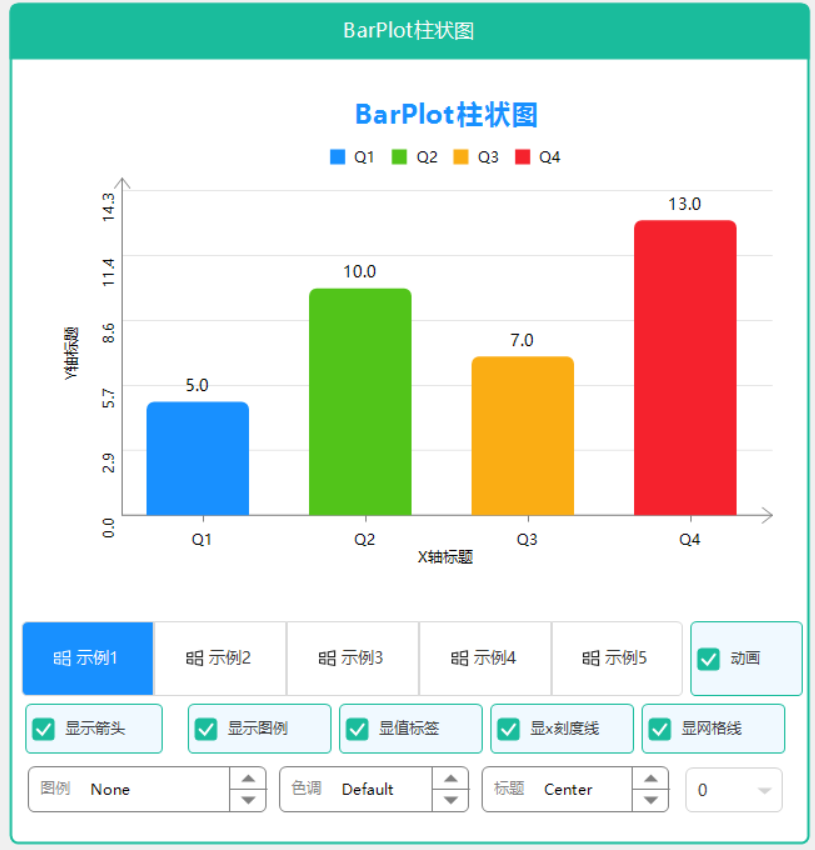
BarPlot 是一个功能强大的柱状图控件,参考 ScottPlot 设计,支持亮暗主题切换、色彩模式、值标签显示、对比柱状图、标题设置和图例显示。
主要特性
- 简单易用:参考 ScottPlot API,几行代码即可创建专业图表
- 亮暗主题:自动适配亮色/暗色主题
- 色彩模式:支持 Primary/Success/Warning/Error 等功能色
- 值标签显示:支持在柱子顶部显示数值标签
- 对比柱状图:支持多组数据并排对比显示
- 图例支持:可显示多系列数据的图例说明
- 标题支持:支持设置图表标题
- 动画效果:支持柱状图绘制动画,值标签随动画动态变化
- 属性变更通知:实现 INotifyPropertyChanged,属性值改变立即生效
基本使用
简单柱状图
// 创建柱状图控件
var barPlot = new BarPlot
{
    Dock = DockStyle.Fill,
    ColorType = ColorType.Primary
};

// 添加数据
double[] values = { 5, 10, 7, 13 };
barPlot.AddBars(values);

// 刷新显示
barPlot.RefreshPlot();

this.Controls.Add(barPlot);
设置标题
barPlot.Title = "销售统计";
barPlot.TitlePosition = TitlePosition.Center;  // Left, Center, Right
显示图例
barPlot.ShowLegend = true;
属性说明
| 属性名 | 类型 | 默认值 | 说明 |
|---|---|---|---|
| Series | List |
- | 数据系列集合 |
| ColorType | ColorType | Primary | 色彩类型 |
| ShowGrid | bool | true | 是否显示网格线 |
| ShowLegend | bool | false | 是否显示图例 |
| LegendMode | LegendMode | Series | 图例模式:Series-按系列显示,Items-按柱体显示 |
| LegendOrientation | LegendOrientation | Horizontal | 图例方向:Horizontal-横向排列,Vertical-纵向排列 |
| LegendPosition | LegendPosition | TopRight | 图例位置 |
| ShowAxis | bool | true | 是否显示坐标轴 |
| ShowAxisArrows | bool | false | 是否显示坐标轴箭头 |
| ArrowSize | float | 10 | 箭头大小 |
| Title | string | "" | 标题文本 |
| TitlePosition | TitlePosition | Center | 标题位置:Left, Center, Right |
| TitleBold | bool | true | 标题是否加粗 |
| TitleFontSize | float | 16 | 标题字体大小 |
| TitleColor | Color | Empty | 标题颜色(Empty时使用前景色) |
| TitleMargin | float | 10 | 标题与下方元素(图例或数据区)的间距 |
| LegendMargin | float | 40 | 图例与下方元素的间距:图例在上时控制图例与数据区的间距,图例在下时控制图例与X轴标题的间距 |
| XAxisTitle | string | "" | X轴标题 |
| YAxisTitle | string | "" | Y轴标题 |
| XAxisTitleOffset | float | 35 | X轴标题距X轴的距离 |
| YAxisTitleOffset | float | 30 | Y轴标题距Y轴的距离 |
| XAxisLabelAngle | float | 0 | X轴标签旋转角度(度) |
| YAxisLabelAngle | float | 0 | Y轴标签旋转角度(度) |
| EnableAnimation | bool | true | 是否启用动画效果 |
| AnimationDuration | float | 1200 | 动画持续时间(毫秒) |
| FollowGlobalTheme | bool | true | 是否跟随全局主题 |